ConvertAndPlotDataInMultifit
Conversion to Multifit format
Once your macro has run. You will have to convert those CHI files to the internal multifit format. Return to multifit and select the Data handling -> Convert CHI to IDL: multiple sets menu item and, once again, fill up the form!
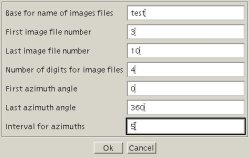
Converting chi files into Multifit format
For each image (e.g. test_0003), it will read the corresponding chi files (e.g. test_0003_0.chi to test_0003_360.chi) and store them in a binary file with a idl extension (e.g. test_0003.idl).
Loading the data in Multifit
To load the data into into Multifit, select the Input files -> Multiple input files menu item and fill up a form as described below
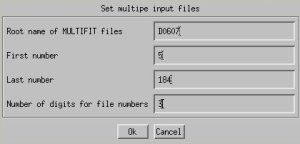
Load data in multifit
This example will load data from D0607_005.idl to D0607_184.idl. The file loaded will appear in the Active datasets panel of the main window.
Plotting the data: Mapplot
To plot a dataset in as color contours, select the set to plot, and hit the Mapplot button below the file list, and you'll get something like this
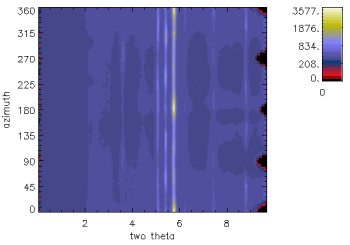
Mapplot
Plotting the: 2-D plot
To plot a dataset in 2-D, select the set to plot, and hit the Plot button. You will have a dialog window with options to choose
- azimuth values for which to plot the diffractograms
- a stretch factor (larger values will bring the plots together)
- how often to label azimuth angles
- the 2 theta range
Play around with the parameters and you should be able to plot something like this
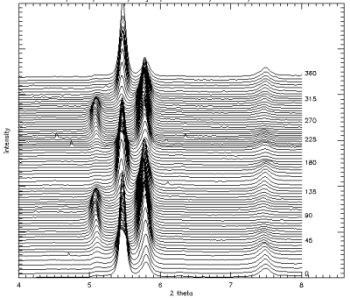
2-D plot