LatticePreferredOrientations
Refinement of Lattice Preferred Orientations
Finally, we do get to the lattice preferred orientations! Do do not attempt to refine texture if the rest of the fit is not stable, you should already have a good match for
- backgrounds
- peak positions
- peak profiles
before getting into preferred orientations...
Displaying LPO
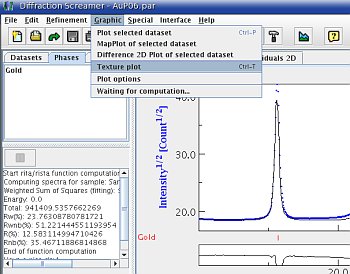
At this point, you probably did not fit LPO, but it usefull to introduce how and where to plot LPO results in MAUD. Basically, everything is accessed in the main window, from the texture plot item in the graphics window.
You will find several useful functions such as
- pole figure coverage: for each peak, this function will plot the actual pole figure coverage provided by your experimental data. In high pressure DAC experiment, it should look like the figure below.
- Experimental intensities: the experimental pole figures
- Recalculated intensities: the pole figures recalculated from the ODF
- Inverse pole figures
 | Starting the pole figure plotting functions |
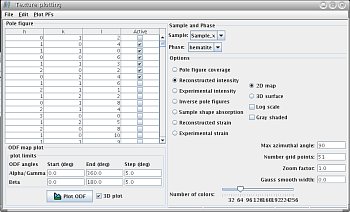 | 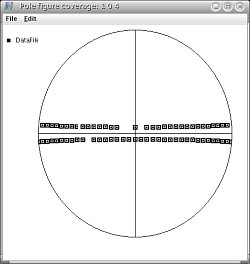 |
| The texture plot window | Pole figure coverage |
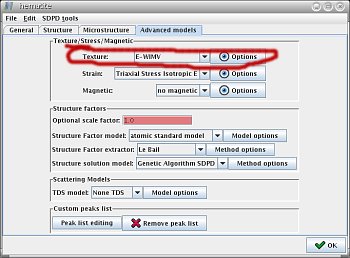
The Advanced Models tab
Preferred orientation models
In order to apply LPO, select the phase property window, texture is in the Advanced models tab.
Several models could be usefull:
nonesimply assumes that the sample does not show any LPO.arbitrary texwill put whatever intensity fits the data.�Obviously, this model is not physical, but it is usefull for refining peak positions only.WIMWandE-WINWactually fit an orientation distribution function (ODF) and they are the functions we will use...
WIMW and E-WIMW are both based on the the discrete WIMW algorithm for determining an orientation distribution function from complete or incomplete pole figures (Matthies and Vinel, 1982). To make a long story short, E-WIMW is an updated version of WIMW. In particular, E-WIMW appears to be more flexible with the experimental pole figure coverage for inverting ODF.
Trick!!! In E-WIMW, MAUD normalizes all experimental pole figures. It means that MAUD assumes that the average of the intensity measured for each peak corresponds to that obtained from the structure factors. If your sample is textured and if you do not measure the full pole figure, it won't be the case. You need to remove this option. To do so, click on E-WIMW Advanced Options and disable the option Normalize pole figures.
E-WIMW: no symmetry
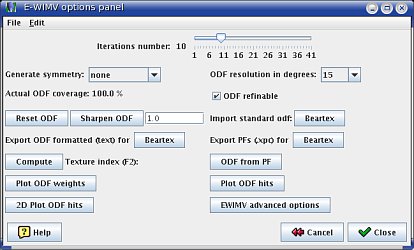
The E-WIMV Option Panel
In general, high pressure textures should display a cylindrical symmetry around the compression axis. However, if you do have strong textures in your sample, MAUD will be able to refine your texture with no imposed symmetry and allow you to actually test this hypothesis.
If you do not wish to apply symmetry, the only option to check in the E-WIMV option panel is the resolution: choose 15 degrees, unless you believe your data is of exceptionnal quality.
Refine the Texture
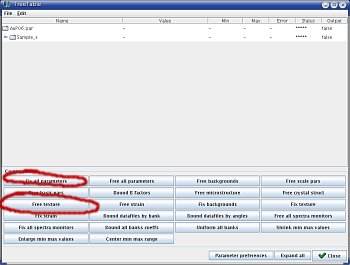
To refine the texture:
- go into the
parameter listwindow, - click on
fix all parameters, - click on
free texture, - start the refinement.
At this point, once again, there is no reciepe, you may want to play with
- the backgrounds,
- the incident intensity,
- the texture,
- and whatever is relevant,
until you get a decent fit.
During the texture adjustment process, make use of the 2-D plot window: it is very usefull to see if the fitted intensities look like the experimental ones.
Finally, once you have a fit you like, well, have a look at your pole figures!
E-WIMW: symmetry
If you are confident that your dataset should display cylindrical symmetry, you can set this option in the E-WIMV options window.
This option is usefull for high pressure experiments as it allows the calculations of inverse pole figures.
Never calculate inverse pole figures for ODF with no applies symmetry! This is meaningless!