GlobalRefinement
Rietveld Refinement
Refinement of parameters with Maud
In the main Maud window, the parameters to refine are located in the main window, below the plots. You can force the refinement of a parameter by clicking on Fixed, it should bring up a menu to set it to Refined...
Incident intensity, detector distance, and main backgrounds
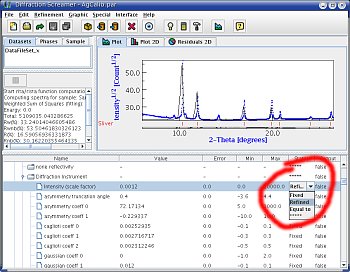
Forcing Maud to refine intensities
As a first step, we will refine:
- the
incident intensity - the
sample to detector distance - the main background paramaters, under
dataFileSet_x,background polynomial coeff 0,background polynomial coeff 1and
background polynomial coeff 2.
Once you have made those parameters as "Refinable", hit the hammer icon (on top of the window), and you'll see the refinement results.
Once the refinement is finished, in the bottom panel, you can see the new value of the parameters, and an error. If this error is equal to -1, there was an error: Maud is not able to refine this parameter.
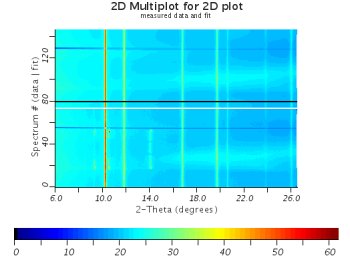
You can plot the result in many way:
- by going back into the dataset, selecting a datafile, and hitting
View. - in the main window, by using the
Plot 2Dfunction: it will show you the original dataset (below) and the recalculated one (above).
At each step, you should always check that you fit is Ok and that Maud did not get out of hands. Save frequently, and use several kind of plots, in many orientations, to make sure everything is Ok...
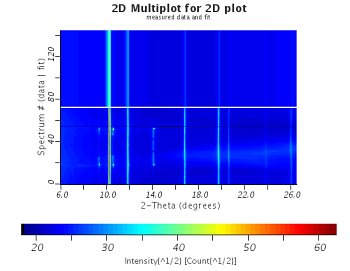 | 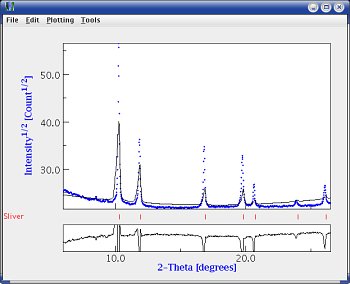 |
| 2D plot comparing the original data and the results | Plot for one orientation only |
Incident intensity and peak profiles
Next step is to get the peak profile to look a little bit more like the data:
- Fix all backgrounds
- Set the following parameters for refinement:
incident intensitycaglioti coeff 0caglioti coeff 1caglioti coeff 2sample to detector distance
and run a refinement.
It should look a lot nicer. Depending on your data, you could also play with the caglioti and gaussian coefficients. It does not matter, as long as you get a nice match between your data and the fit.
Individual backgrounds
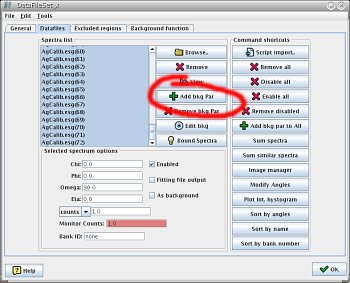 |  |
| Adding individual background paramaters | Setting background refinement in the parameter list window |
At this point, it is usefull to add background parameters for each spectra. I usually have 3 parameters for each one. To add those,
- go into the dataset window,
- select all datasets,
- click on
Add bkg parthree times.
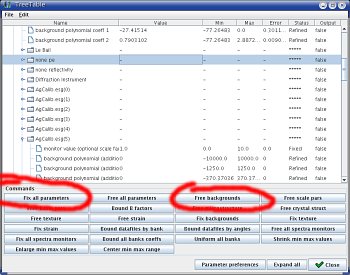
Now we want to refine all those background... You could go and make them refineable one by one, but it would take for ever!! There is an easier way,
- in the
Refinementmenu (in the main menu bar, on top of the Maud window), selectParameter List. - in the
Parameter Listwindow, selectFix all parameters - select
Free backgrounds - in the table, you should see all backgrounds set to
Refined - launch a refinement (the hammer icon), it could take some time...
Your fit should get better and better!
Detector re-calibration
Now, we'll make sure that our detector calibration is Ok. In the parameter list window
- fix all parameters
- go into
sample X>dataFileSet_X>Diffraction Instrument>Flat image transmission - set the sample to detector distance, beam center, and tilt parameters to be refineable.
- start a refinement.
Your fit should get really good by now!
Material properties
At this point, you can start refining sample properties, fix everything else. In my experience I find that to get a perfect fit, you have to play with the crystallite size and microstrains (under isotropic).
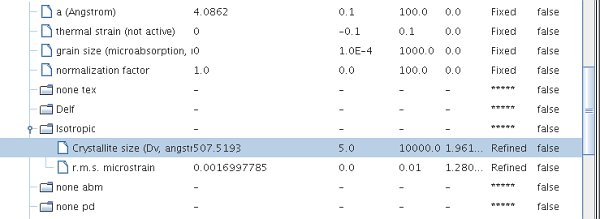
Refining crystallite size and microstrains
Finally crystallographic parameters (talk with a Rietveld expert) should get you to the end...
Putting it all together
At this point, there is no reciepe:
- play around and refine various parameters
- avoid refining to many parameters at the same time
- avoid refining conflicting parameters together
- save frequently
until you get the perfect fit!!!
In my experience, for a calibration image:
- refine background and beam intensity together,
- refine peak profile and sample properties (crystallite size and microstrains) together.
If you can't get it right, it can be usefull to go back to the manual adjustment, from the Dataset window, View one of them, in the Change parameter in the Tool menu. You can use this function to see what is the effect of each parameter and figure out what to do next...
 | 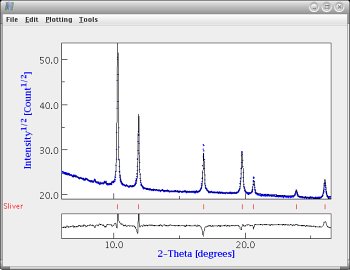 |
| A decent fit (maplot) | A decent fit (regular plot) |